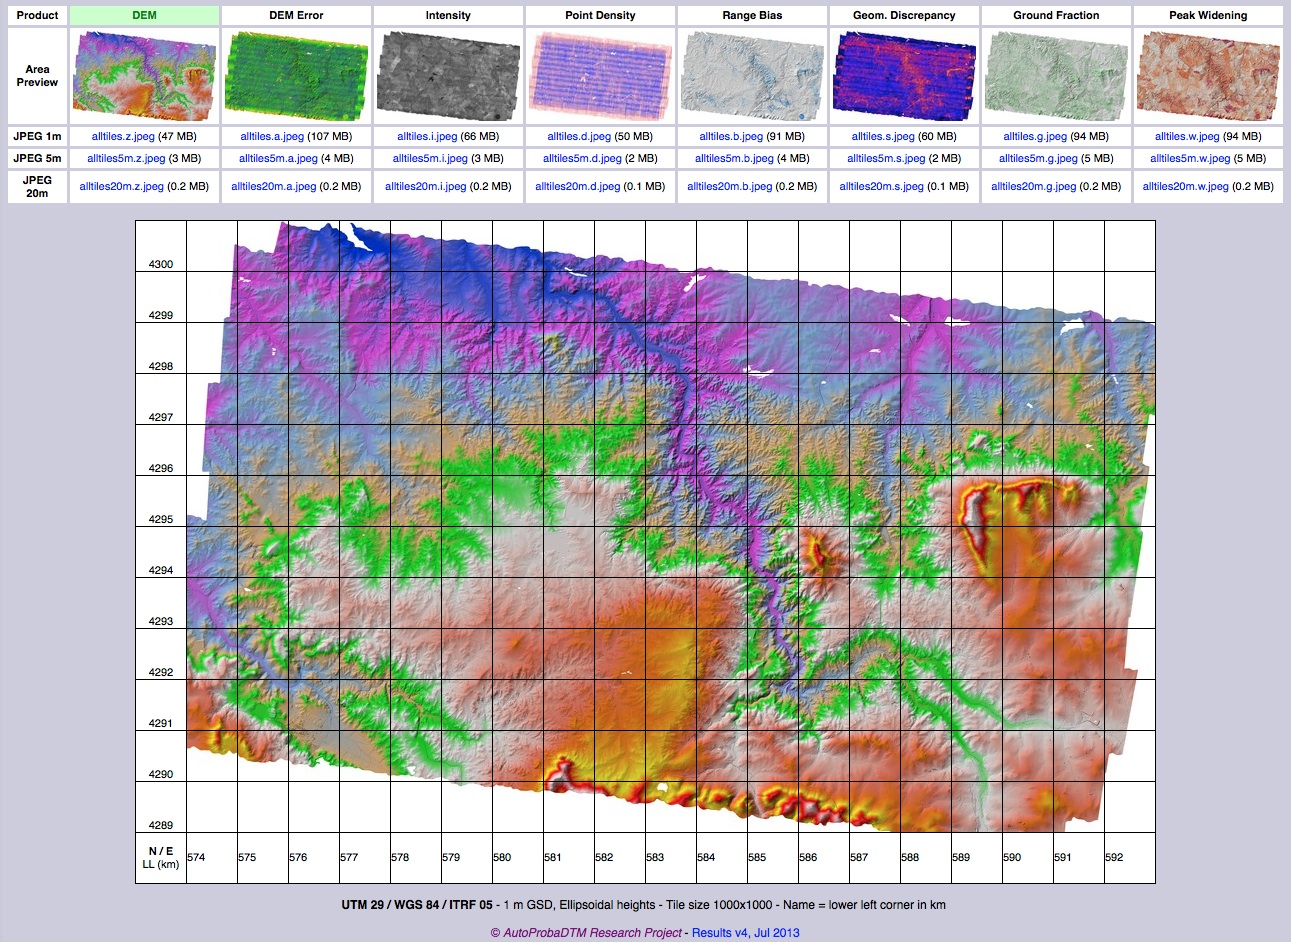
The airborne LiDAR acquisition was done successfully on June 2, 2011, by the French company IMAO (Riegl LMS-Q680i, 1500 m AGL, 240 kHz, final density 3-4 pts/m2). A large-scale DEM of a 200 km2 area was generated from raw waveform data (500 M waveforms, approx. 90 GB data).Running the waveform extraction software on the entire data set took 3.5 hours (dual core Macbook Pro laptop, flight lines extractions ran in parallel). The georeferencing, tiling and fast gridding processes took only 15 minutes total.
216 tiles of 1 square km each at 1 m GSD were generated. GeoTIFF image files were produced for each tile in a UTM 29 projection (WGS 84 ellipsoidal heights), including not only the DEM, but also maps of predictive accuracy, point density, peak widening, inter-strip discrepancy and intensity image; these products are available for download through the tile server. For visualization purposes, derived products were generated such as color composite shaded relief and color-coded accuracy images in jpeg.
The most original contribution of the project: Uncertainty map showing the predictive vertical error for each grid location (1 m GSD).
Location: Monterey CA, USA
Role: LiDAR Task – Probabilistic Change Maps
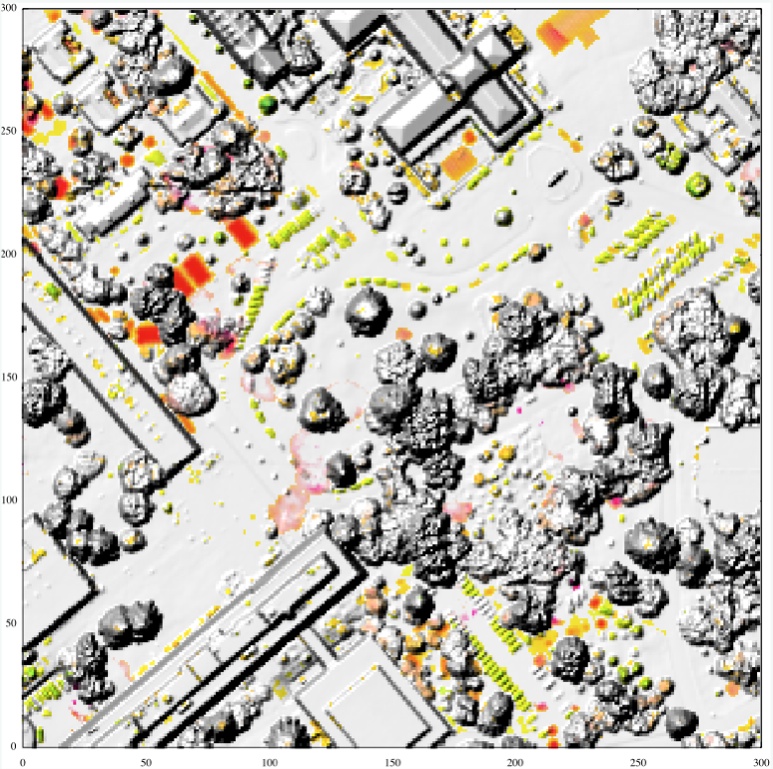
Custom visualization of significant change map WSI-NOAA airborne point clouds, NPS campus, Monterey, CA Only height changes above 95% significance level shown (red = loss, green = gain, saturation increases with flatness)
Pre- and post-event LiDAR data can be used to identify and quantify changes. The main challenge consists of producing reliable change maps that are robust to differences in collection conditions, free of processing artifacts, and that take into account various sources of uncertainty such as different point densities, different acquisition geometries, georeferencing errors and geometric discrepancies.We developed a fast technique that accounts for these sources of uncertainty, and enables the creation of statistically significant change detection maps. The technique makes use of Bayesian inference to estimate uncertainty maps from LiDAR point clouds. Incorporation of uncertainties enables robustness to noise due to ranging, position and attitude errors, as well as ”roughness” in vegetation scans.
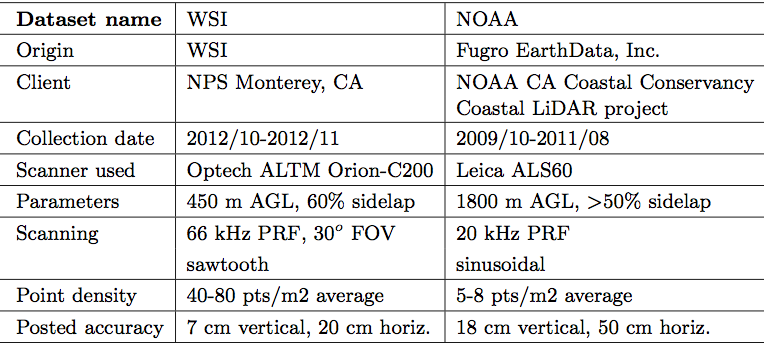
Validation was done using small-scale models scanned with a terrestrial LiDAR. The method was then applied to two airborne collects of the Monterey Peninsula, California acquired in 2011 and 2012. These data have significantly different point densities (8 vs. 40 pts/m2) and some misregistration errors.
An original point cloud registration technique was developed, first to correct systematic shifts due to GPS and INS errors, and second to help measure large-scale changes in a consistent manner. Sparse changes were detected and interpreted mostly as construction and natural landscape evolution. [SPIE paper]
Description of the airborne LiDAR datasets used in this study: WSI and NOAA