Quickly map the statistically significant changes from two point clouds collected under various conditions, with different sensors, data density and quality. This package can process both airborne and terrestrial scans.
Input:
2 LAS point clouds
Output:
GeoTIFF binary change map, [GeoTIFF custom color visualization product]
Advantages:
Flexibility: unfiltered point clouds, airborne & terrestrial
Rigorous statistical significance of changes
Automatic global alignment for planimetric error compensation
Intuitive visualization scheme option
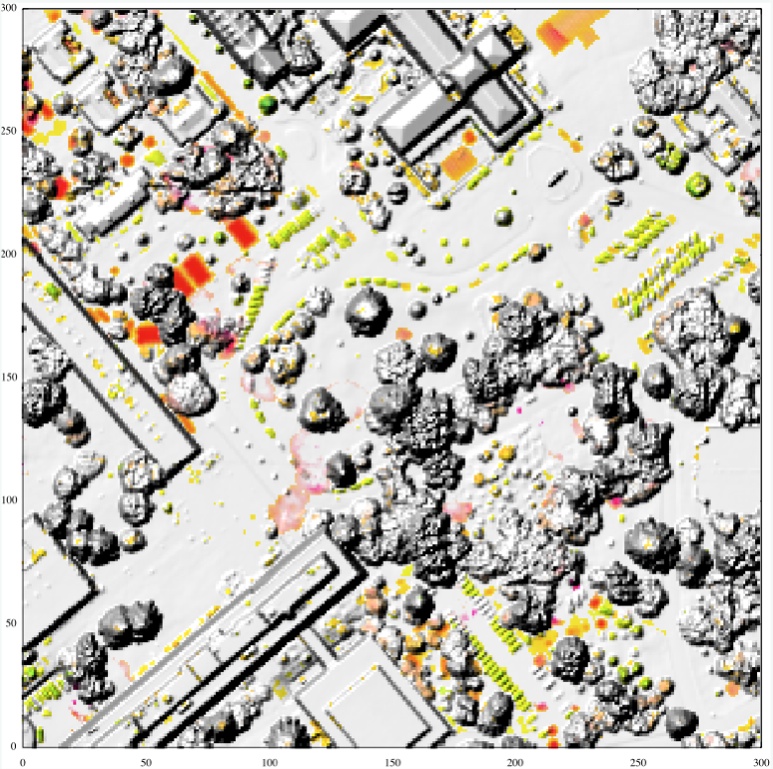
Custom visualization of significant change map. Airborne point clouds collected by NOAA and WSI, NPS campus, Monterey, CA. Only height changes above 95% significance level are shown (red = loss, green = gain, saturation increases with flatness). The threshold is set by the user, but it has a precise meaning, unlike the one used in common DSM differencing, which is irrelevant as elevation accuracy is spatially variable. Rigorous change detection, along with custom visualization, helps first responders quickly identify potentially damaged areas.
Your benefits
Accuracy improvement
Correcting systematic errors by treating them as parameters and applying Bayesian inference is a powerful way to improve the data accuracy; dataset registration is a good example of significant improvement.
Automation
Manually tuning essential processing parameters is no longer necessary.
Some tasks require accurate alignment of multi-temporal datasets. Probabilistic approaches provide automatic ways of registering point clouds or elevation models while being robust to changes and noise.
Uncertainty management
Understanding how uncertainty affects elevation is essential for shape analysis and change detection. Also, assessing the statistical significance of events (e.g. change or flood) requires spatial uncertainty. This does not come with the data, but we help you compute it!